Year-Over-Year (YOY)
Y-O-Y Calculator (Click Here or Scroll Down)

Year over year (YOY) is a financial formula that represents the annual increase or decrease for a particular metric (see examples of various metrics further on the page. Earnings per share is one such example).
The Y-O-Y formula is often presented as a percentage. Occasionally, a nonpercentage number may be quoted, but in these examples, only simple subtraction is used and the writer is simply using this phrase to convey "a difference from one year to the next". An example of this would be "Variable X is up $2.20 Y-o-Y".
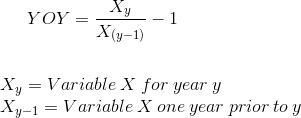
The formula for YOY is found by dividing variable X at the "now" date by variable X one year prior to the "now" date, then subtracting the result by one. To illustrate what is meant by the "now" date, suppose an article was written 6 months ago from today. The article mentions the earnings per share of a particular company, and states that EPS is up 20% YOY. Obviously, they are referencing the date that earnings were released (let us assume 6 months ago at the time the article was written) and the earnings one year prior to that date. The "now" date would be 6 months ago.
The Year Over Year formula has multiple abbreviations, such as YOY, YoY, Y-O-Y, Y/Y, and Y/O/Y. No matter the abbreviation, it will be obvious that the author is referring to a year-over-year change for whatever metric that is discussed.
This formula also applies to a decrease. For example, if this year's X is 800 and the prior year's X is 1,000, the decrease is 20% YOY. If you use the formula at the top of the page, this would be -200 divided by 1000, which results in -20%.
Note: This site uses y and 'y-1' to illustrate that this formula is always used when looking back in the past. This formula may appear to be different than other financial formulas, such as present value and future value, as those formulas look forward (e.g., period x, period x+1, period x+2, et cetera). Even the present value formula discounts future cashflows so it still looks forward when discounting the cashflows to their present values.
Use of the Year Over Year Formula
The year-over-year formula is used with various economic and financial metrics to represent a change from one year to the next. It is primarily used by authors or in general discussion within a company. There is no functional use in the year-over-year formula other than to convey the amount of growth that has occurred over that year.
Examples of financial and economic metrics where an author may use "YOY" include:
- GDP (Gross Domestic Product)
- CPI(Consumer Price Index, for inflation)
- PPI (Producer Price Index)
- EPS (Earnings Per Share)
- Revenues
The year-over-year formula is also sometimes used in non-financial topics.
Examples of the Year-Over-Year (YOY) Formula
1) Suppose that an individual is measuring inflation and using the CPI (Consumer Price Index) to do so. The 'rate of inflation' formula and the year-over-year formula are effectively the same formula. In short, the 'rate of inflation' for one year is the growth in CPI, year-over-year. Both use the "rate of change" formula. Last year's CPI, in this example, had an index of 2,200. The year prior, the same index was 2,000.
Putting these variables into the formula at the top of the page would be:

which shows a growth of 10% year-over year.
2) Suppose that an author is writing an article about a quarterly earnings release issued by a particular company. The author may mention the quarterly eps and would like to express a frame of reference so the user is not just seeing random numbers. Suppose that this year's 3rd quarter earnings were $2.25 per share and last year's 3rd quarter earnings were $1.50.
Using the formula at the top of the page with these variables, this would be:

Which would result in a 50% change over the year. The author may casually state "the Q3 earnings were $2.25 which was a 50% increase YoY" and then go on to state changes in the company or economy that led to the change.
Alternative Year-Over-Year (YOY) Formulas
1.

The formula shown directly above is the standard 'change in' formula. Both this formula and the formula at the top of the page are the same, only rearranged. The denominator of X0 can be factored out to get the formula at the top of the page.
The formulas 'change in' and YoY are the same because YoY is basically a change in a variable from one period to the next. More specifically, the time period would be the change over one year
Some may find this formula easier to mentally compute compared to the one at the top of the page. For example, if 200 and 220 were the variables, respectively, this would be 20 divided by 200 which would be easy to do the math mentally and get 10%. This is not to say that the other formula cannot be mentally computed.
2. The YOY formula at the top of page is not to be confused with "x percent of last year's numbers". Instead of representing a 'change in', this represents a percentage of last year's amount.
Using an extreme example, suppose the variables are 100 and 10, respectively. One could either say "Variable X is down 90% Y/Y" or they could say "This year's numbers are 10% of what they were last year". These two statements obviously do not use the same math and the YoY formula is related to the former and not the latter.
3.

This is 'Delta X'. Delta is used in various financial formulas and non-financial formulas to resemble a 'change in' a variable. Keep in mind that Delta X is not presented as a percentage. It is simply the difference between the current year and prior year.
- Formulas related to YOY